PyTorch Inference Speed vs VRAM vs PSNR Charts
All charts were generated using generate_charts.py. For this benchmark data in tabular format please see the Benchmarks page. An interactive tableau chart of this data is also available here, created by Enhance Everything Discord member SharekhaN.
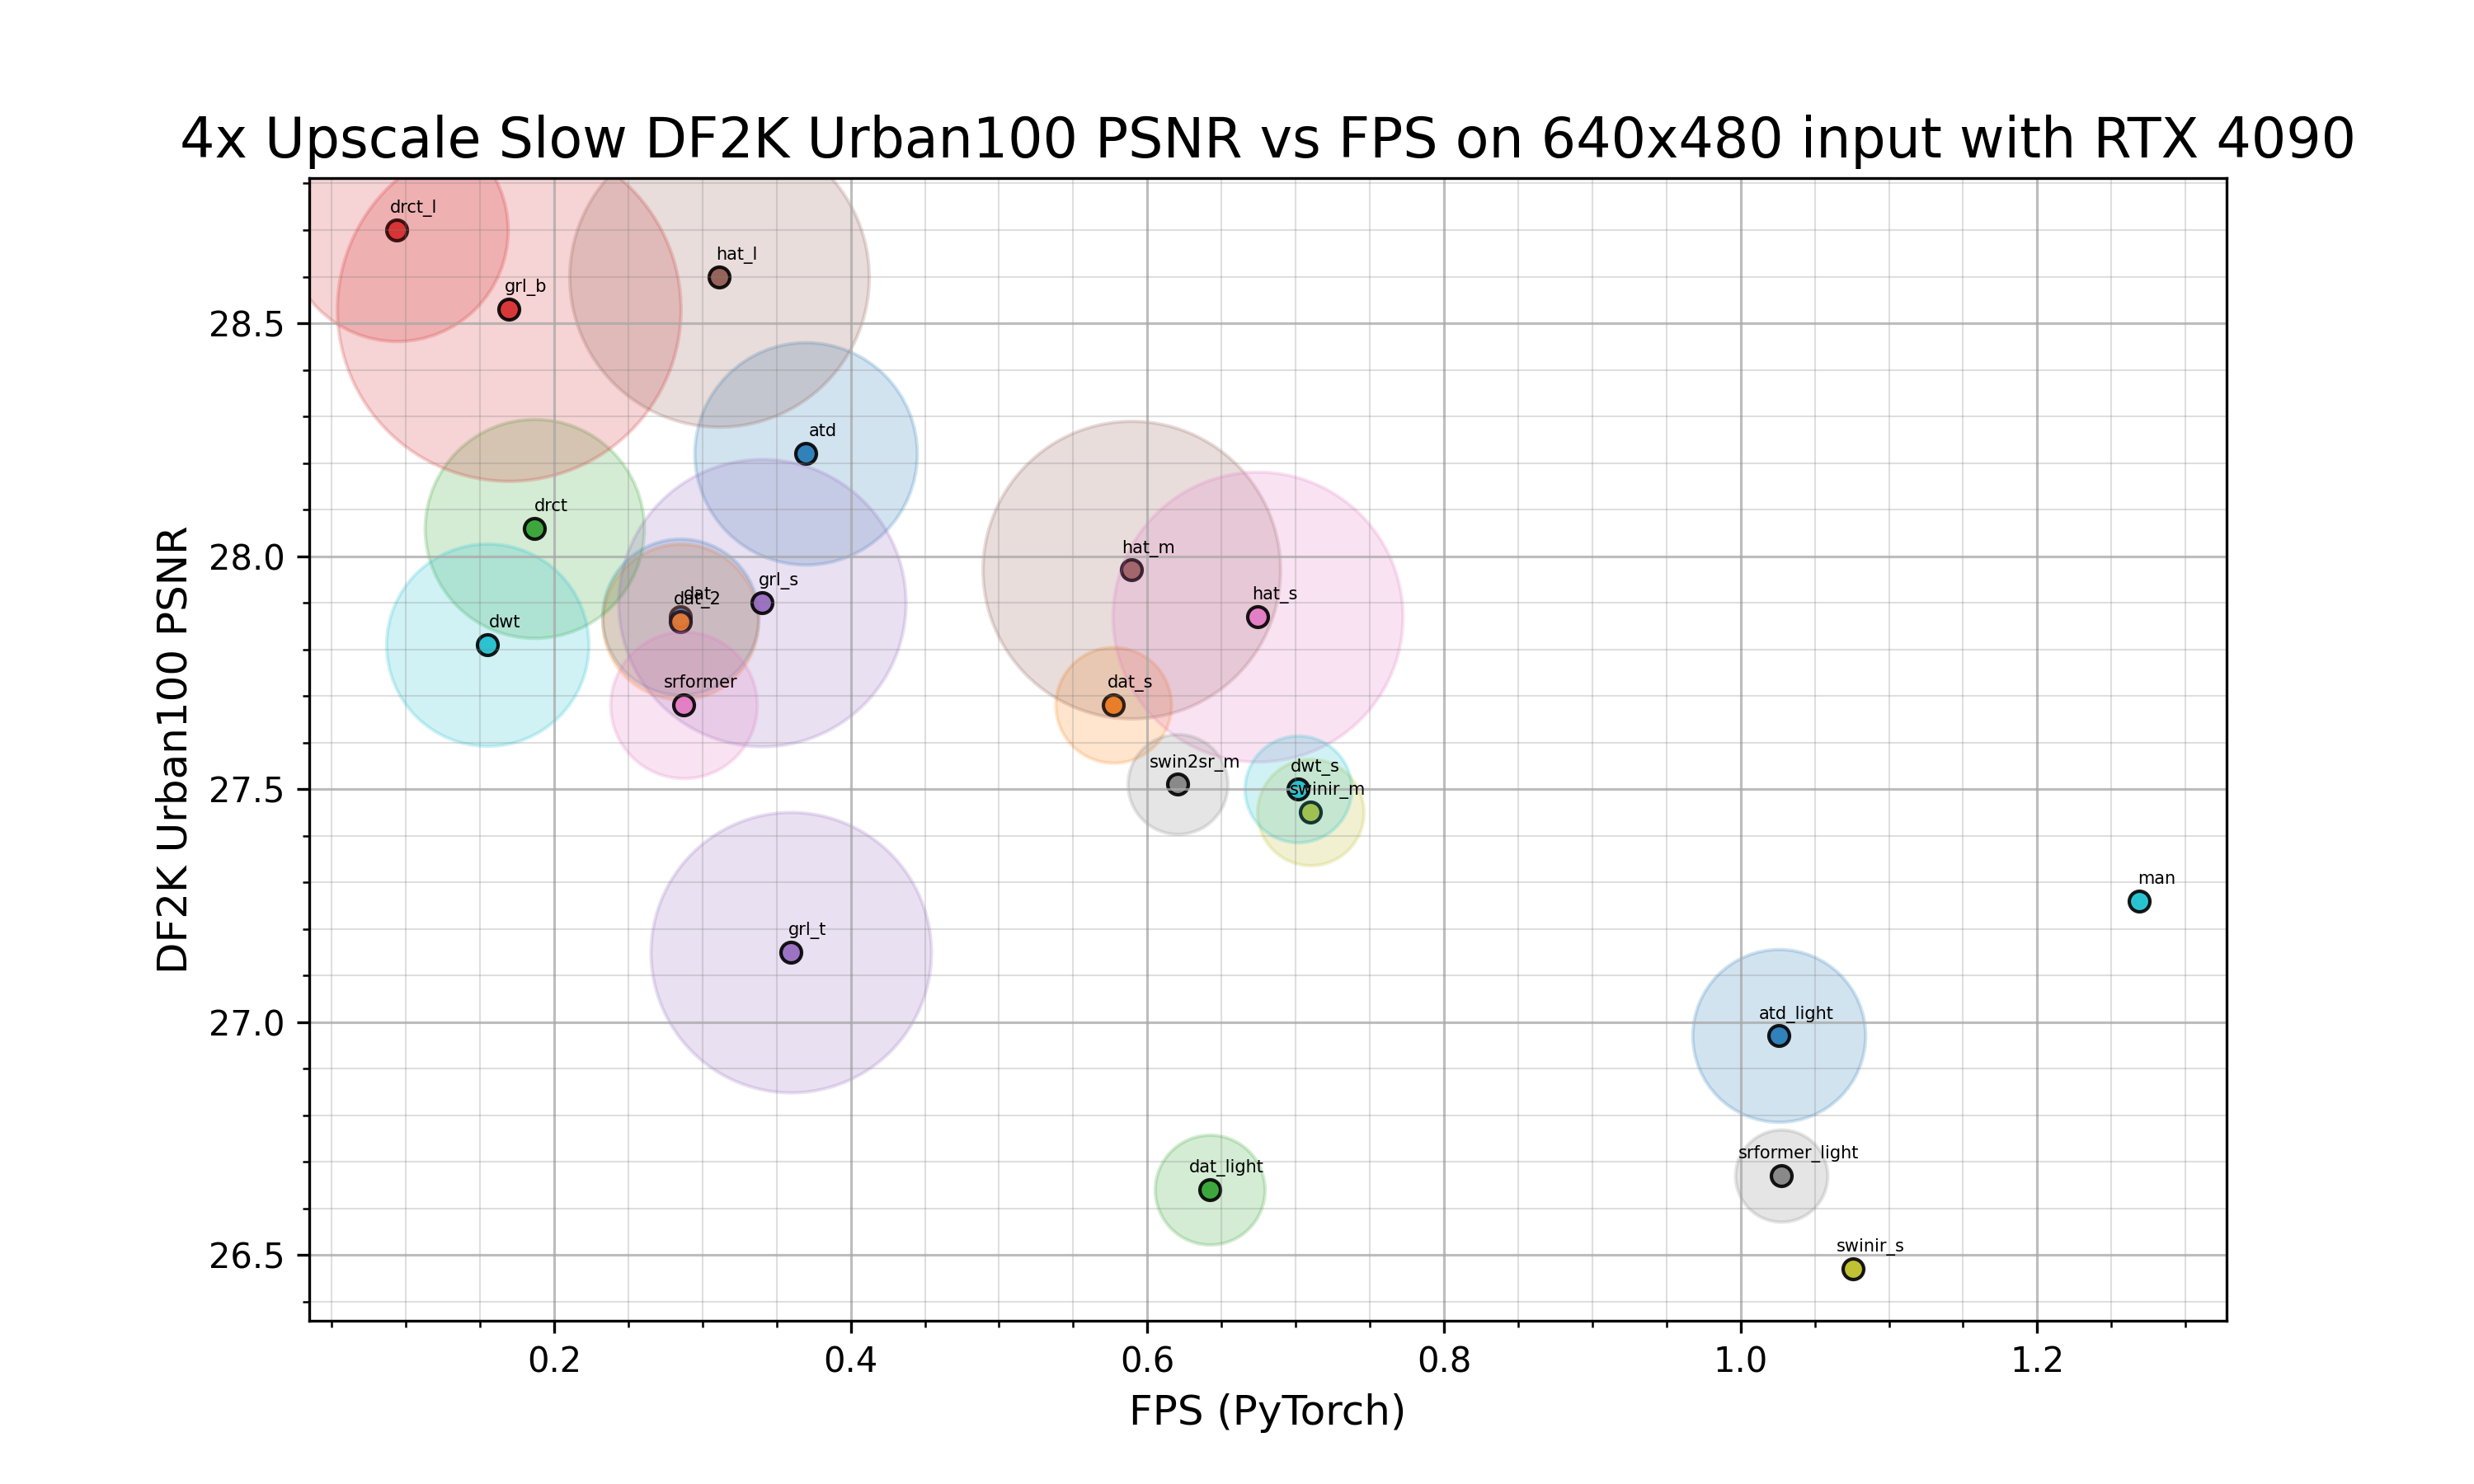
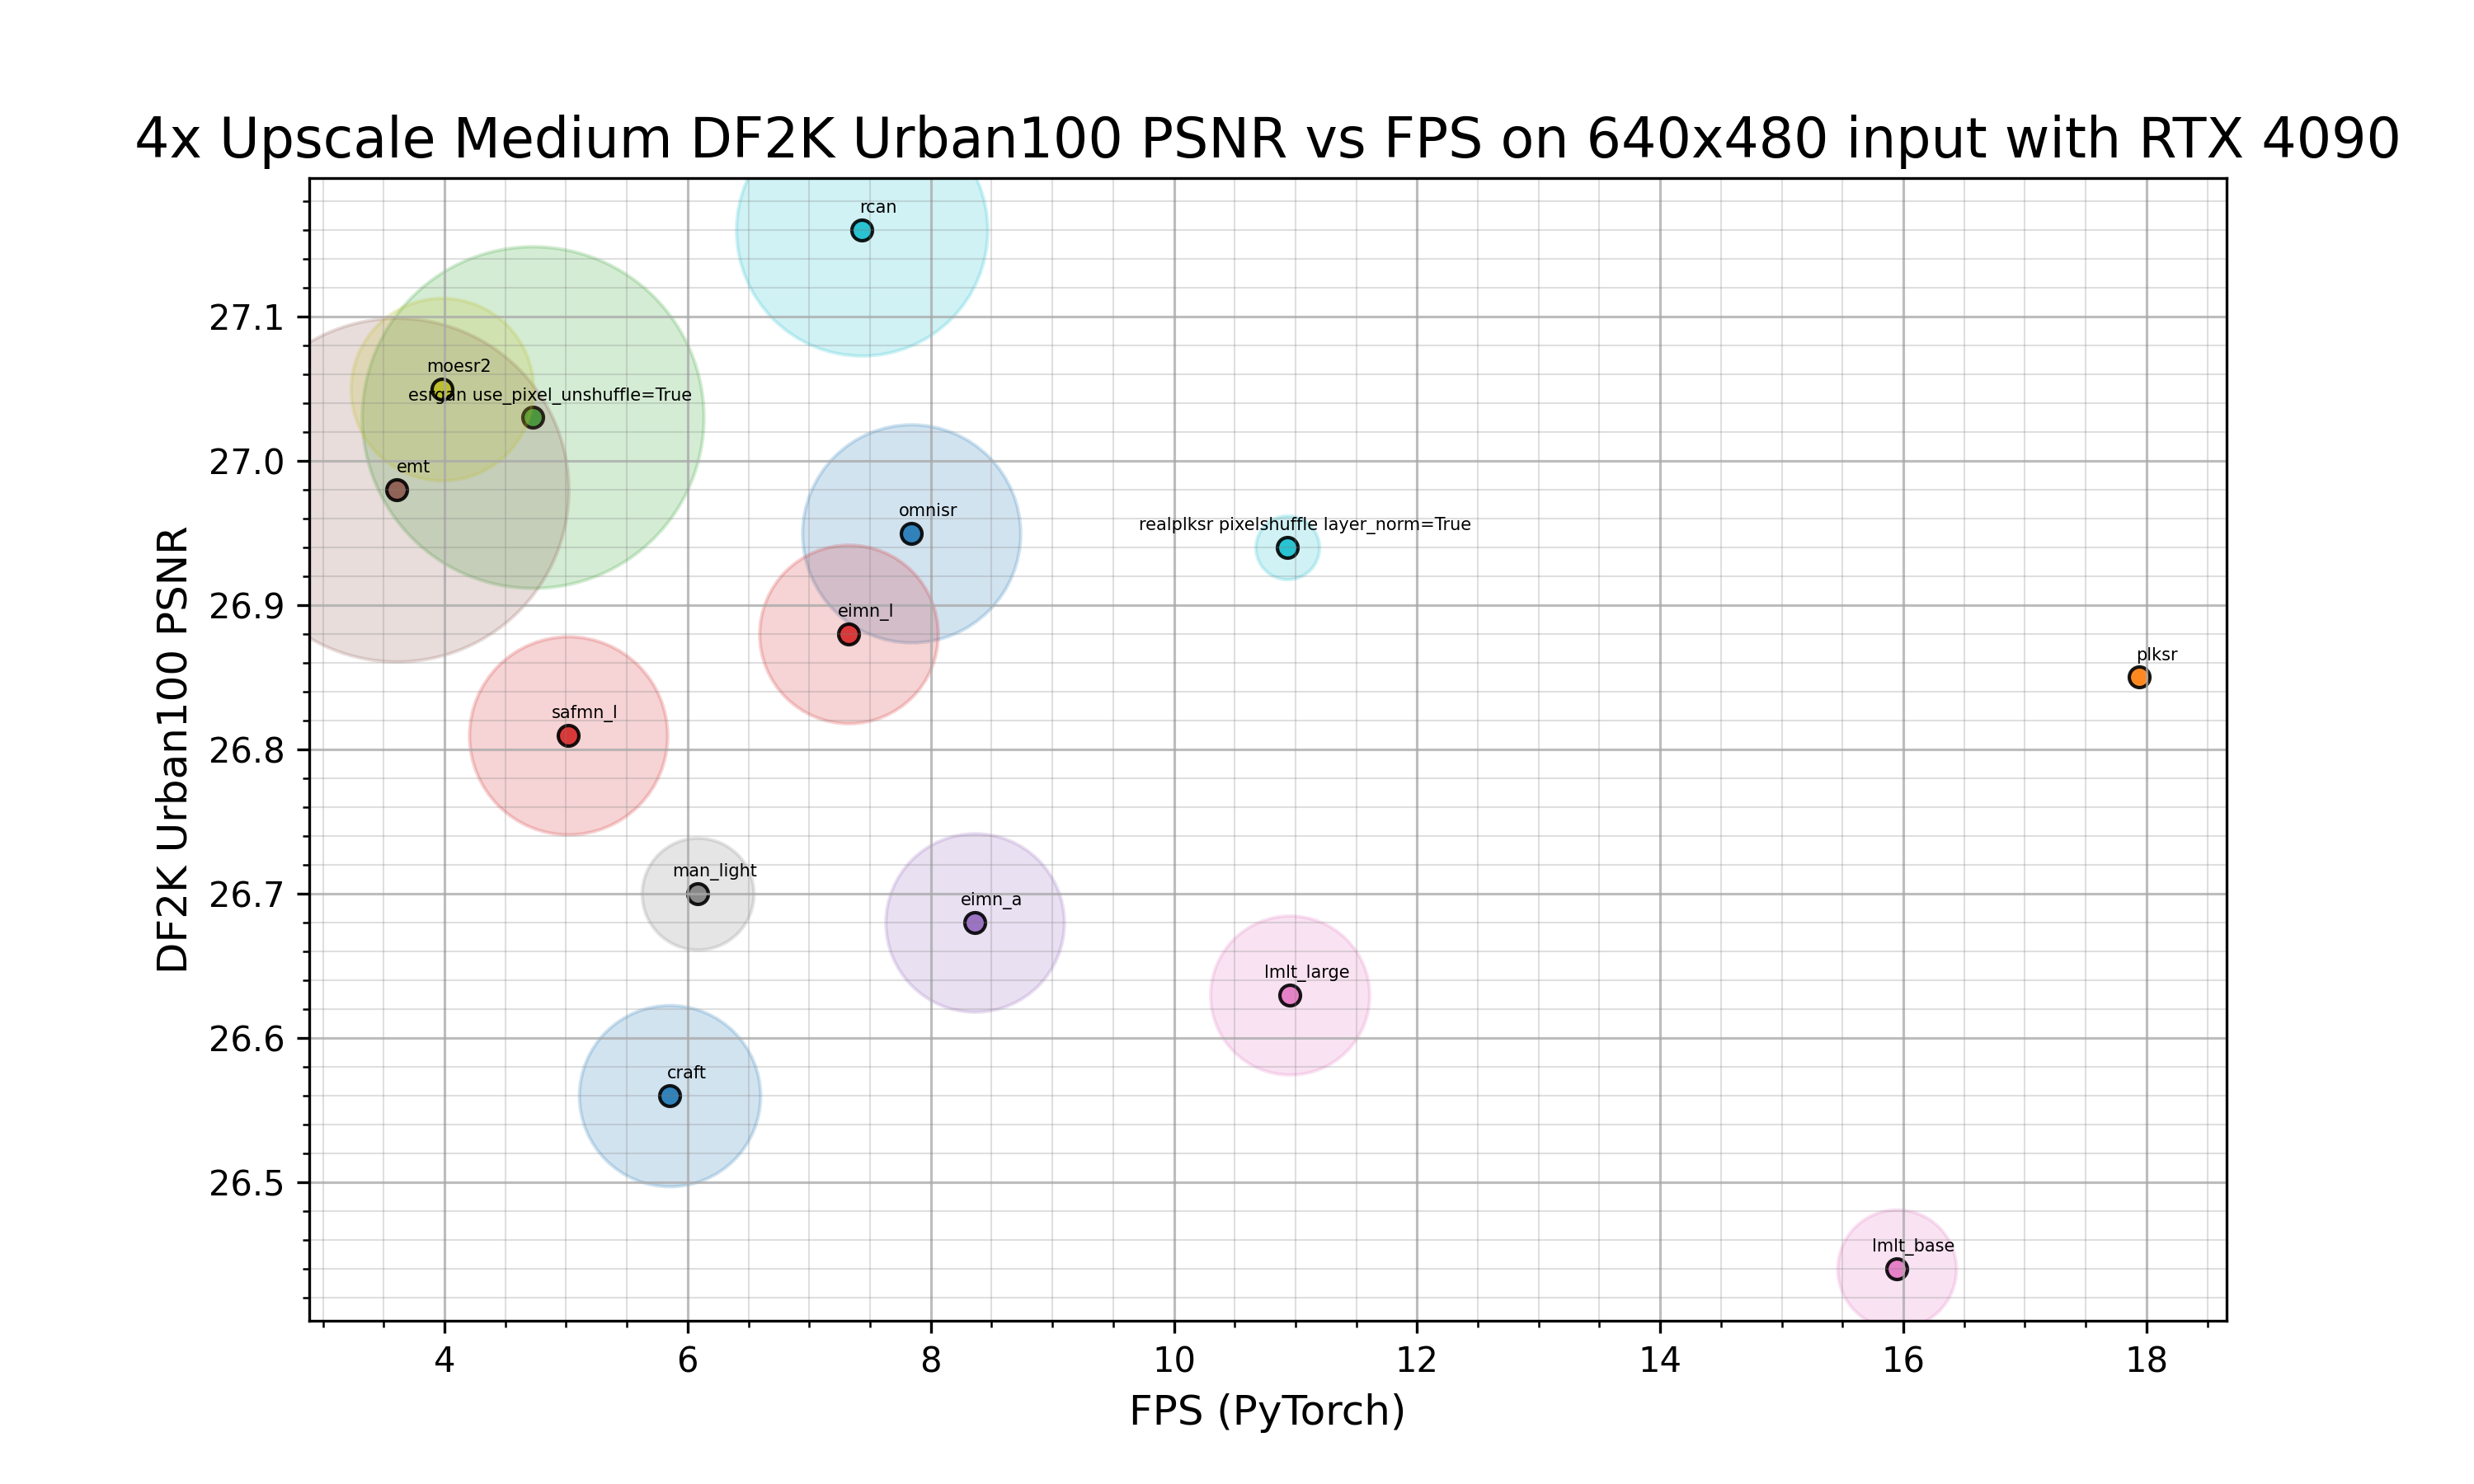
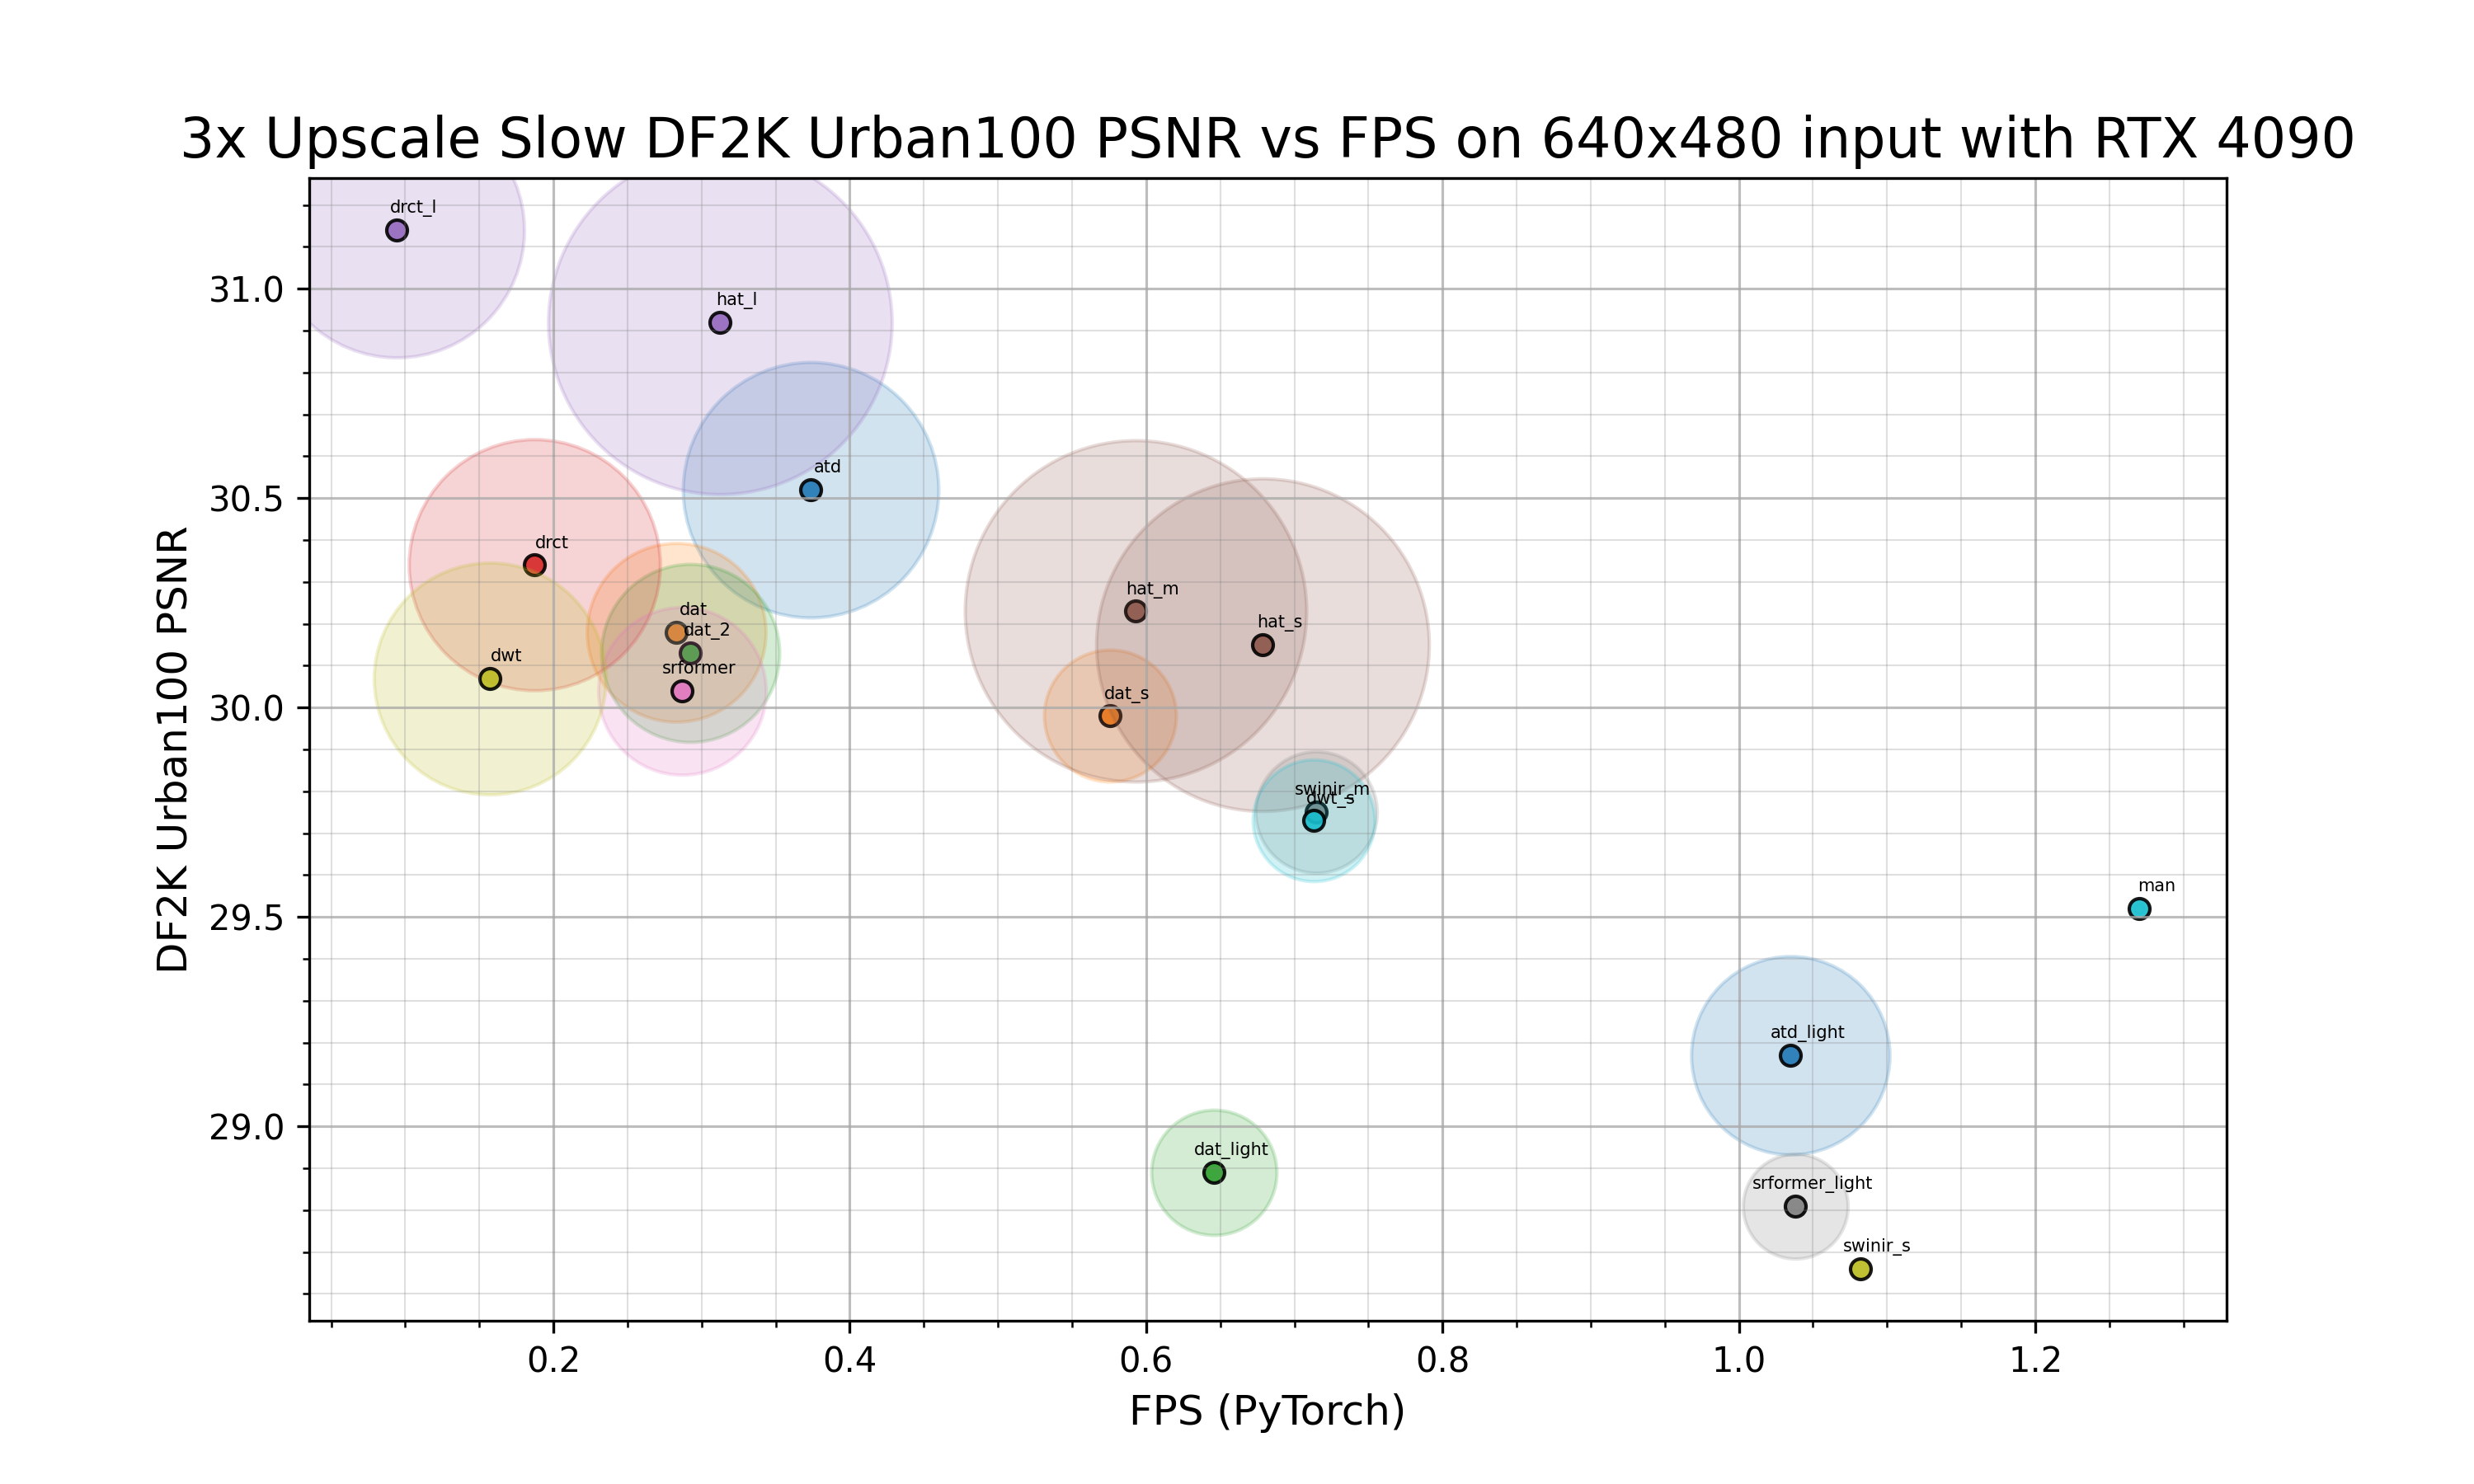
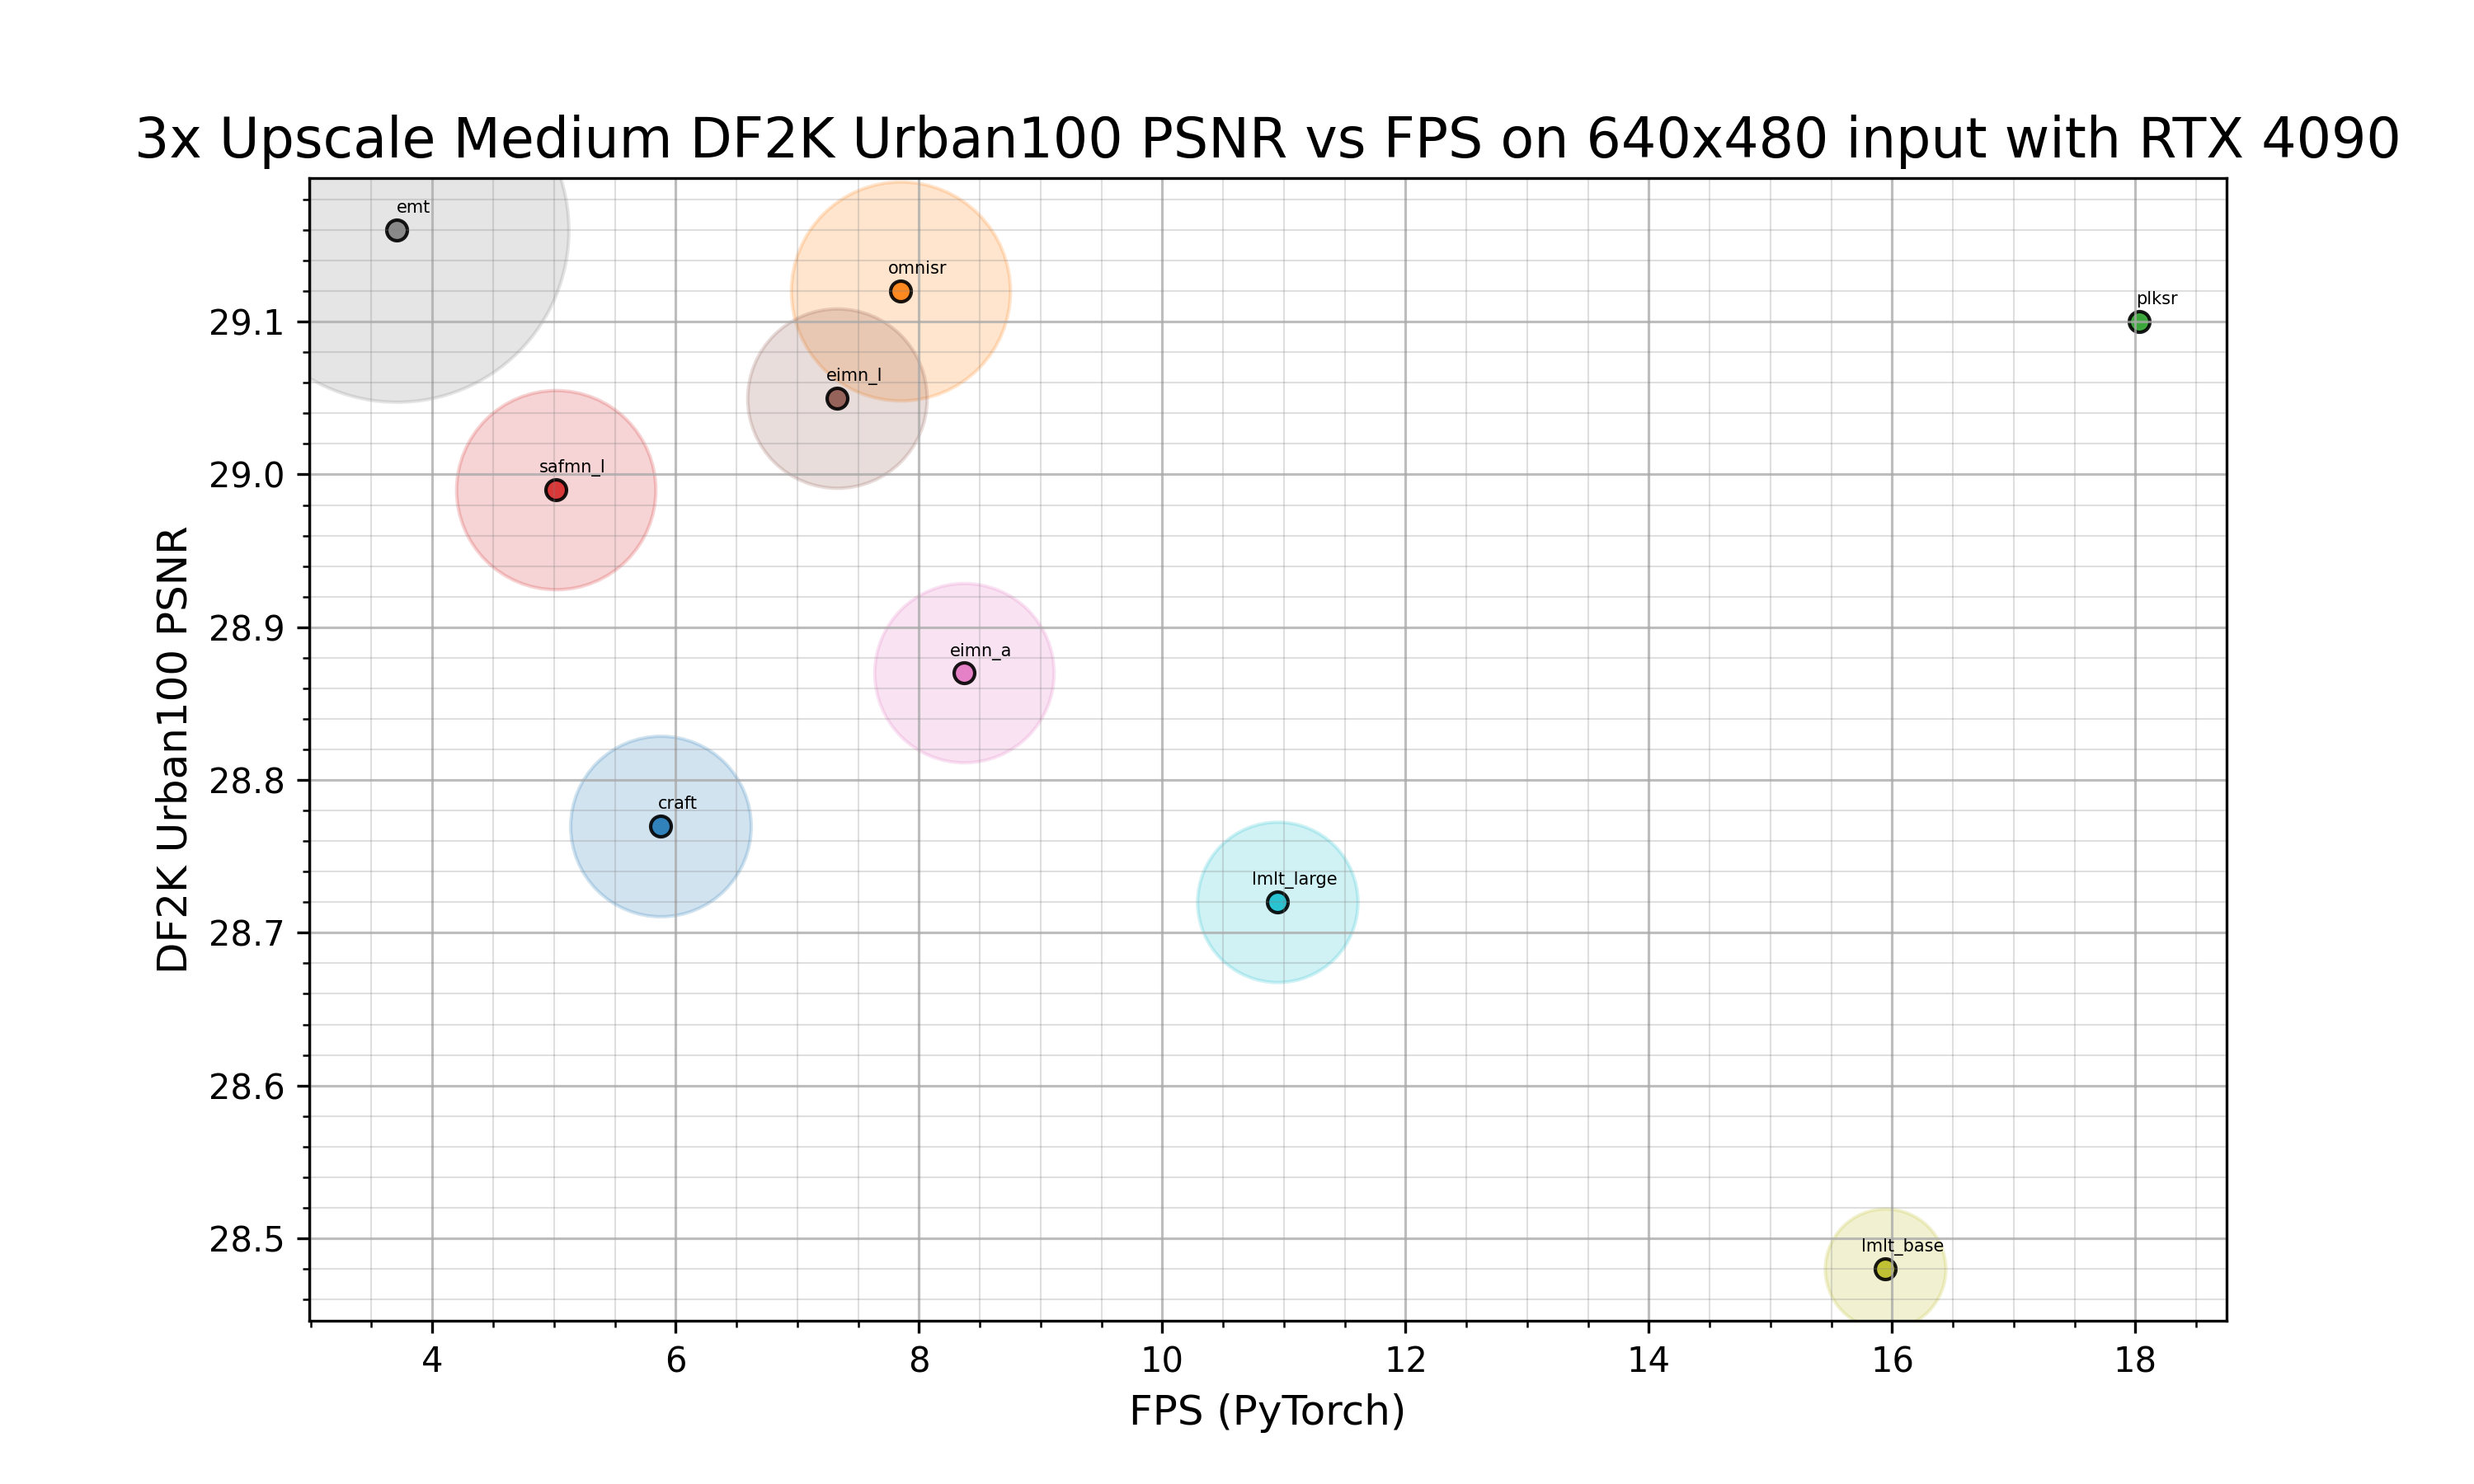
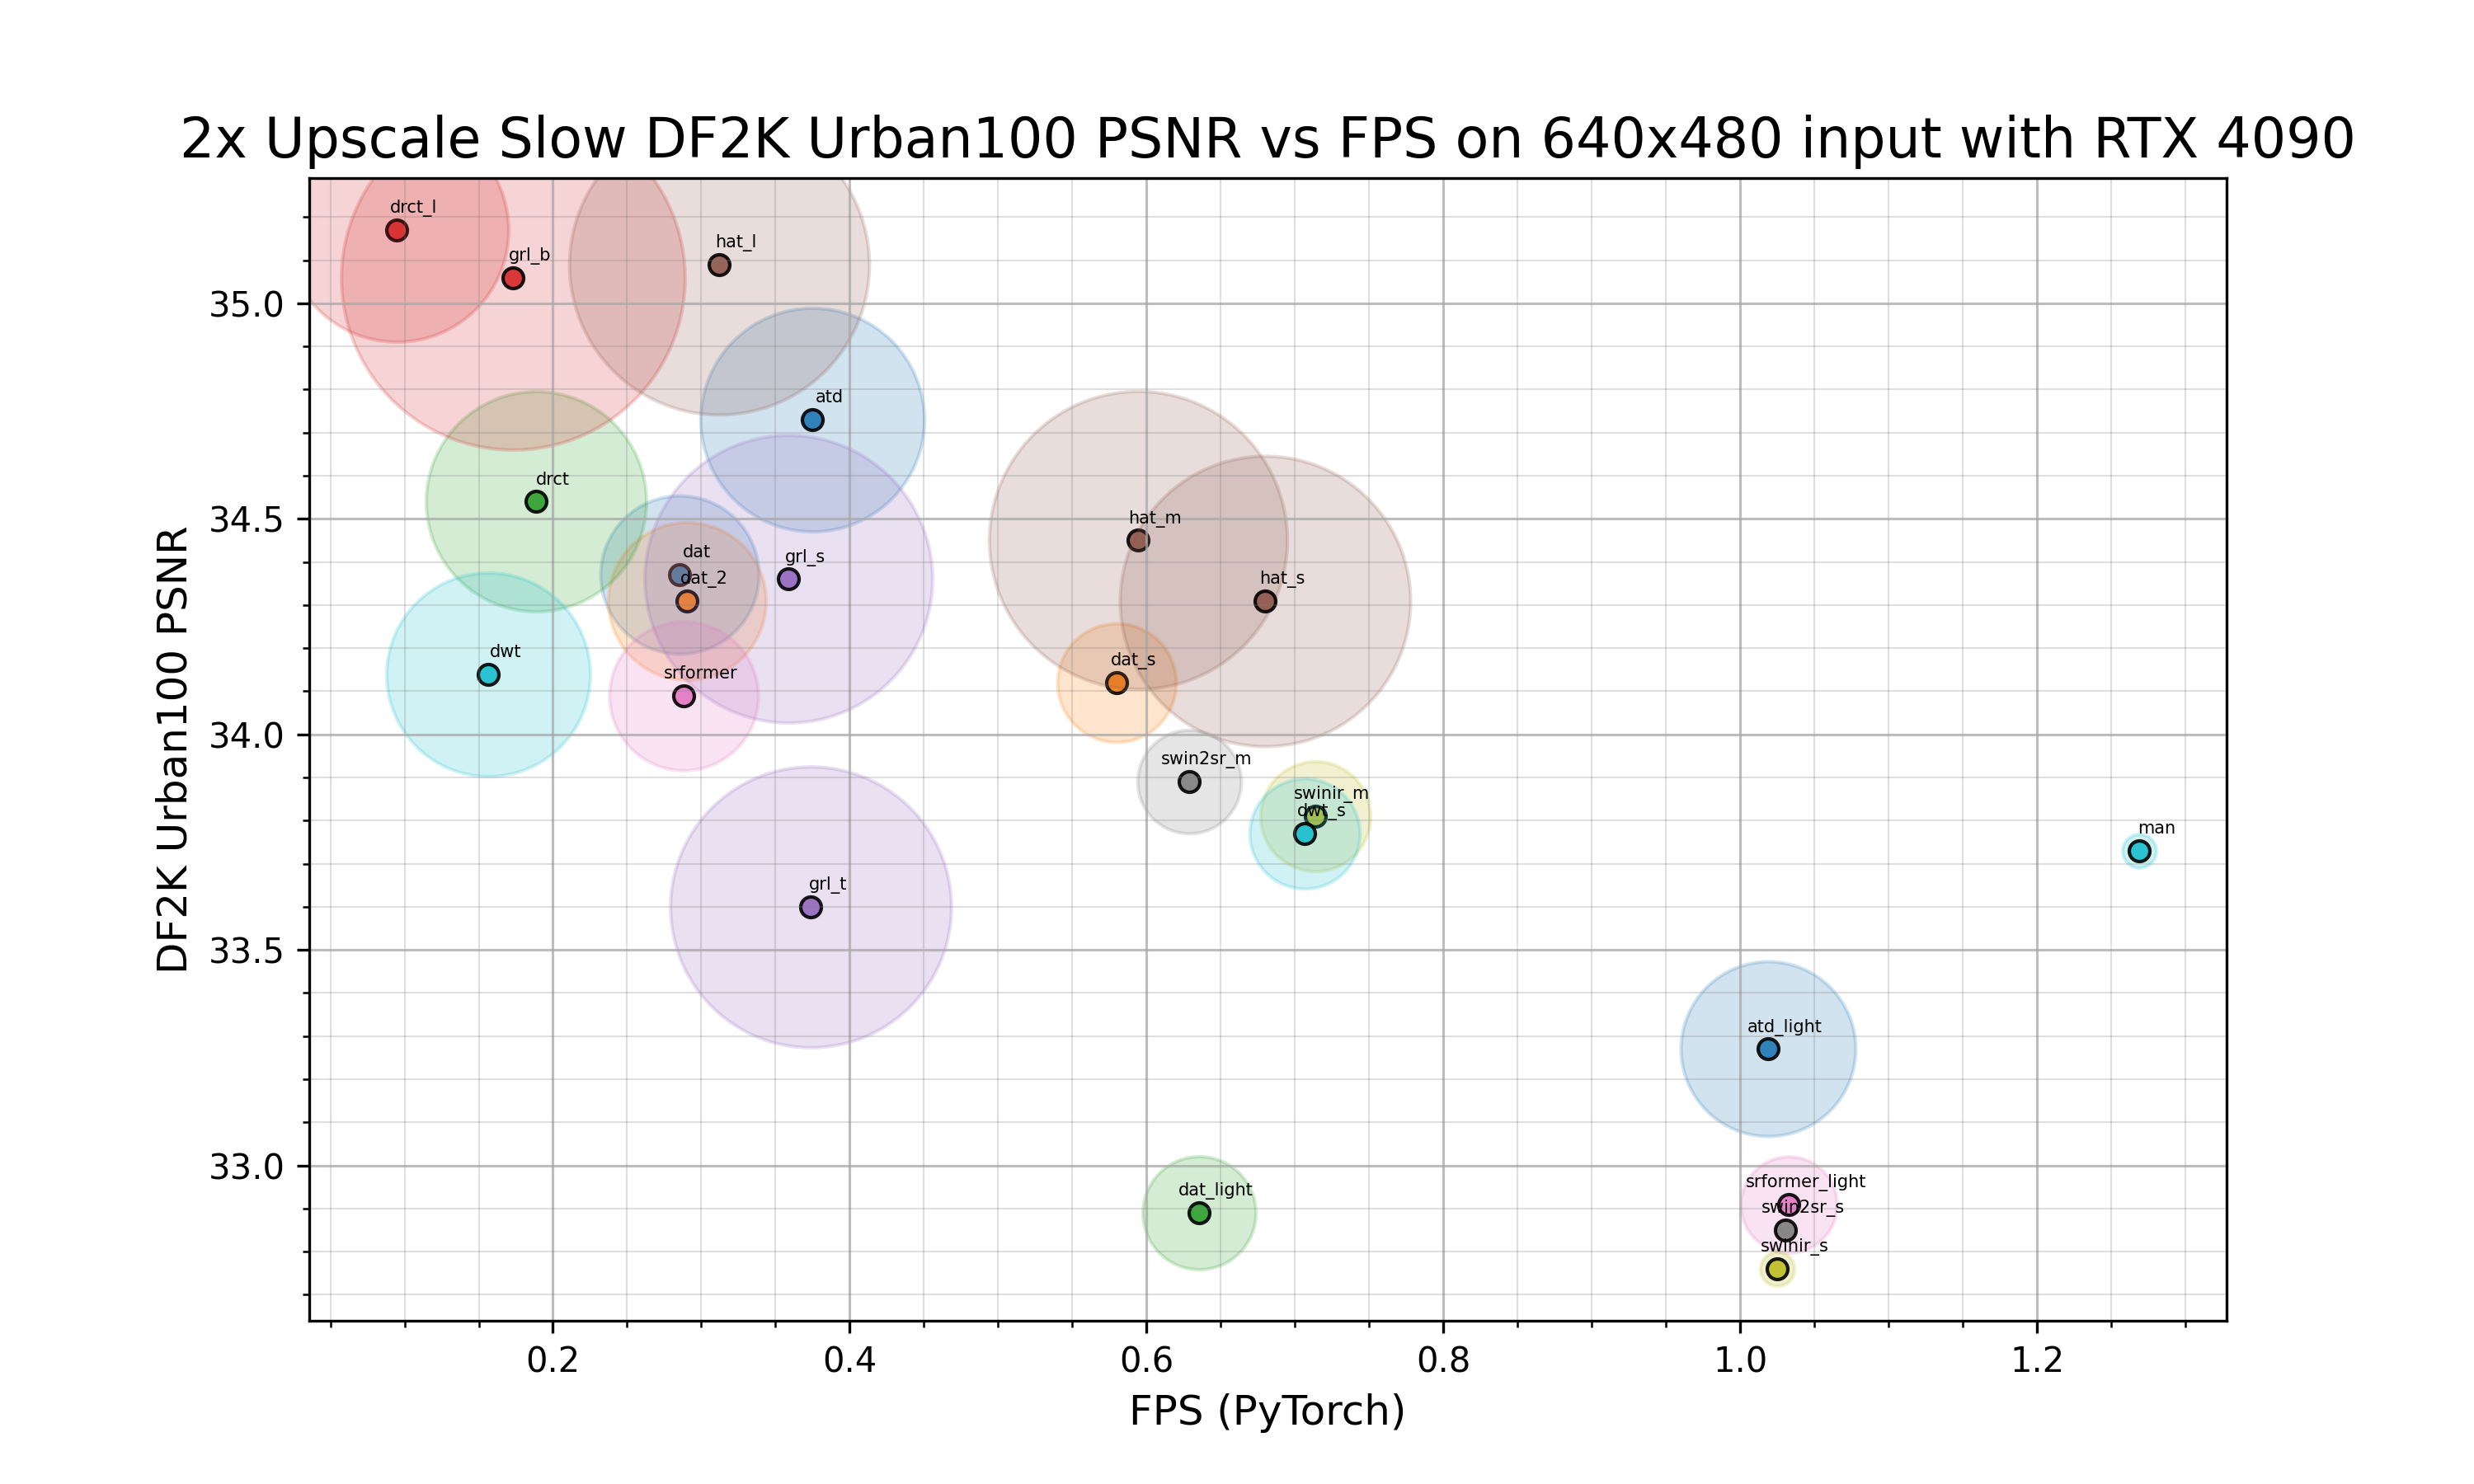
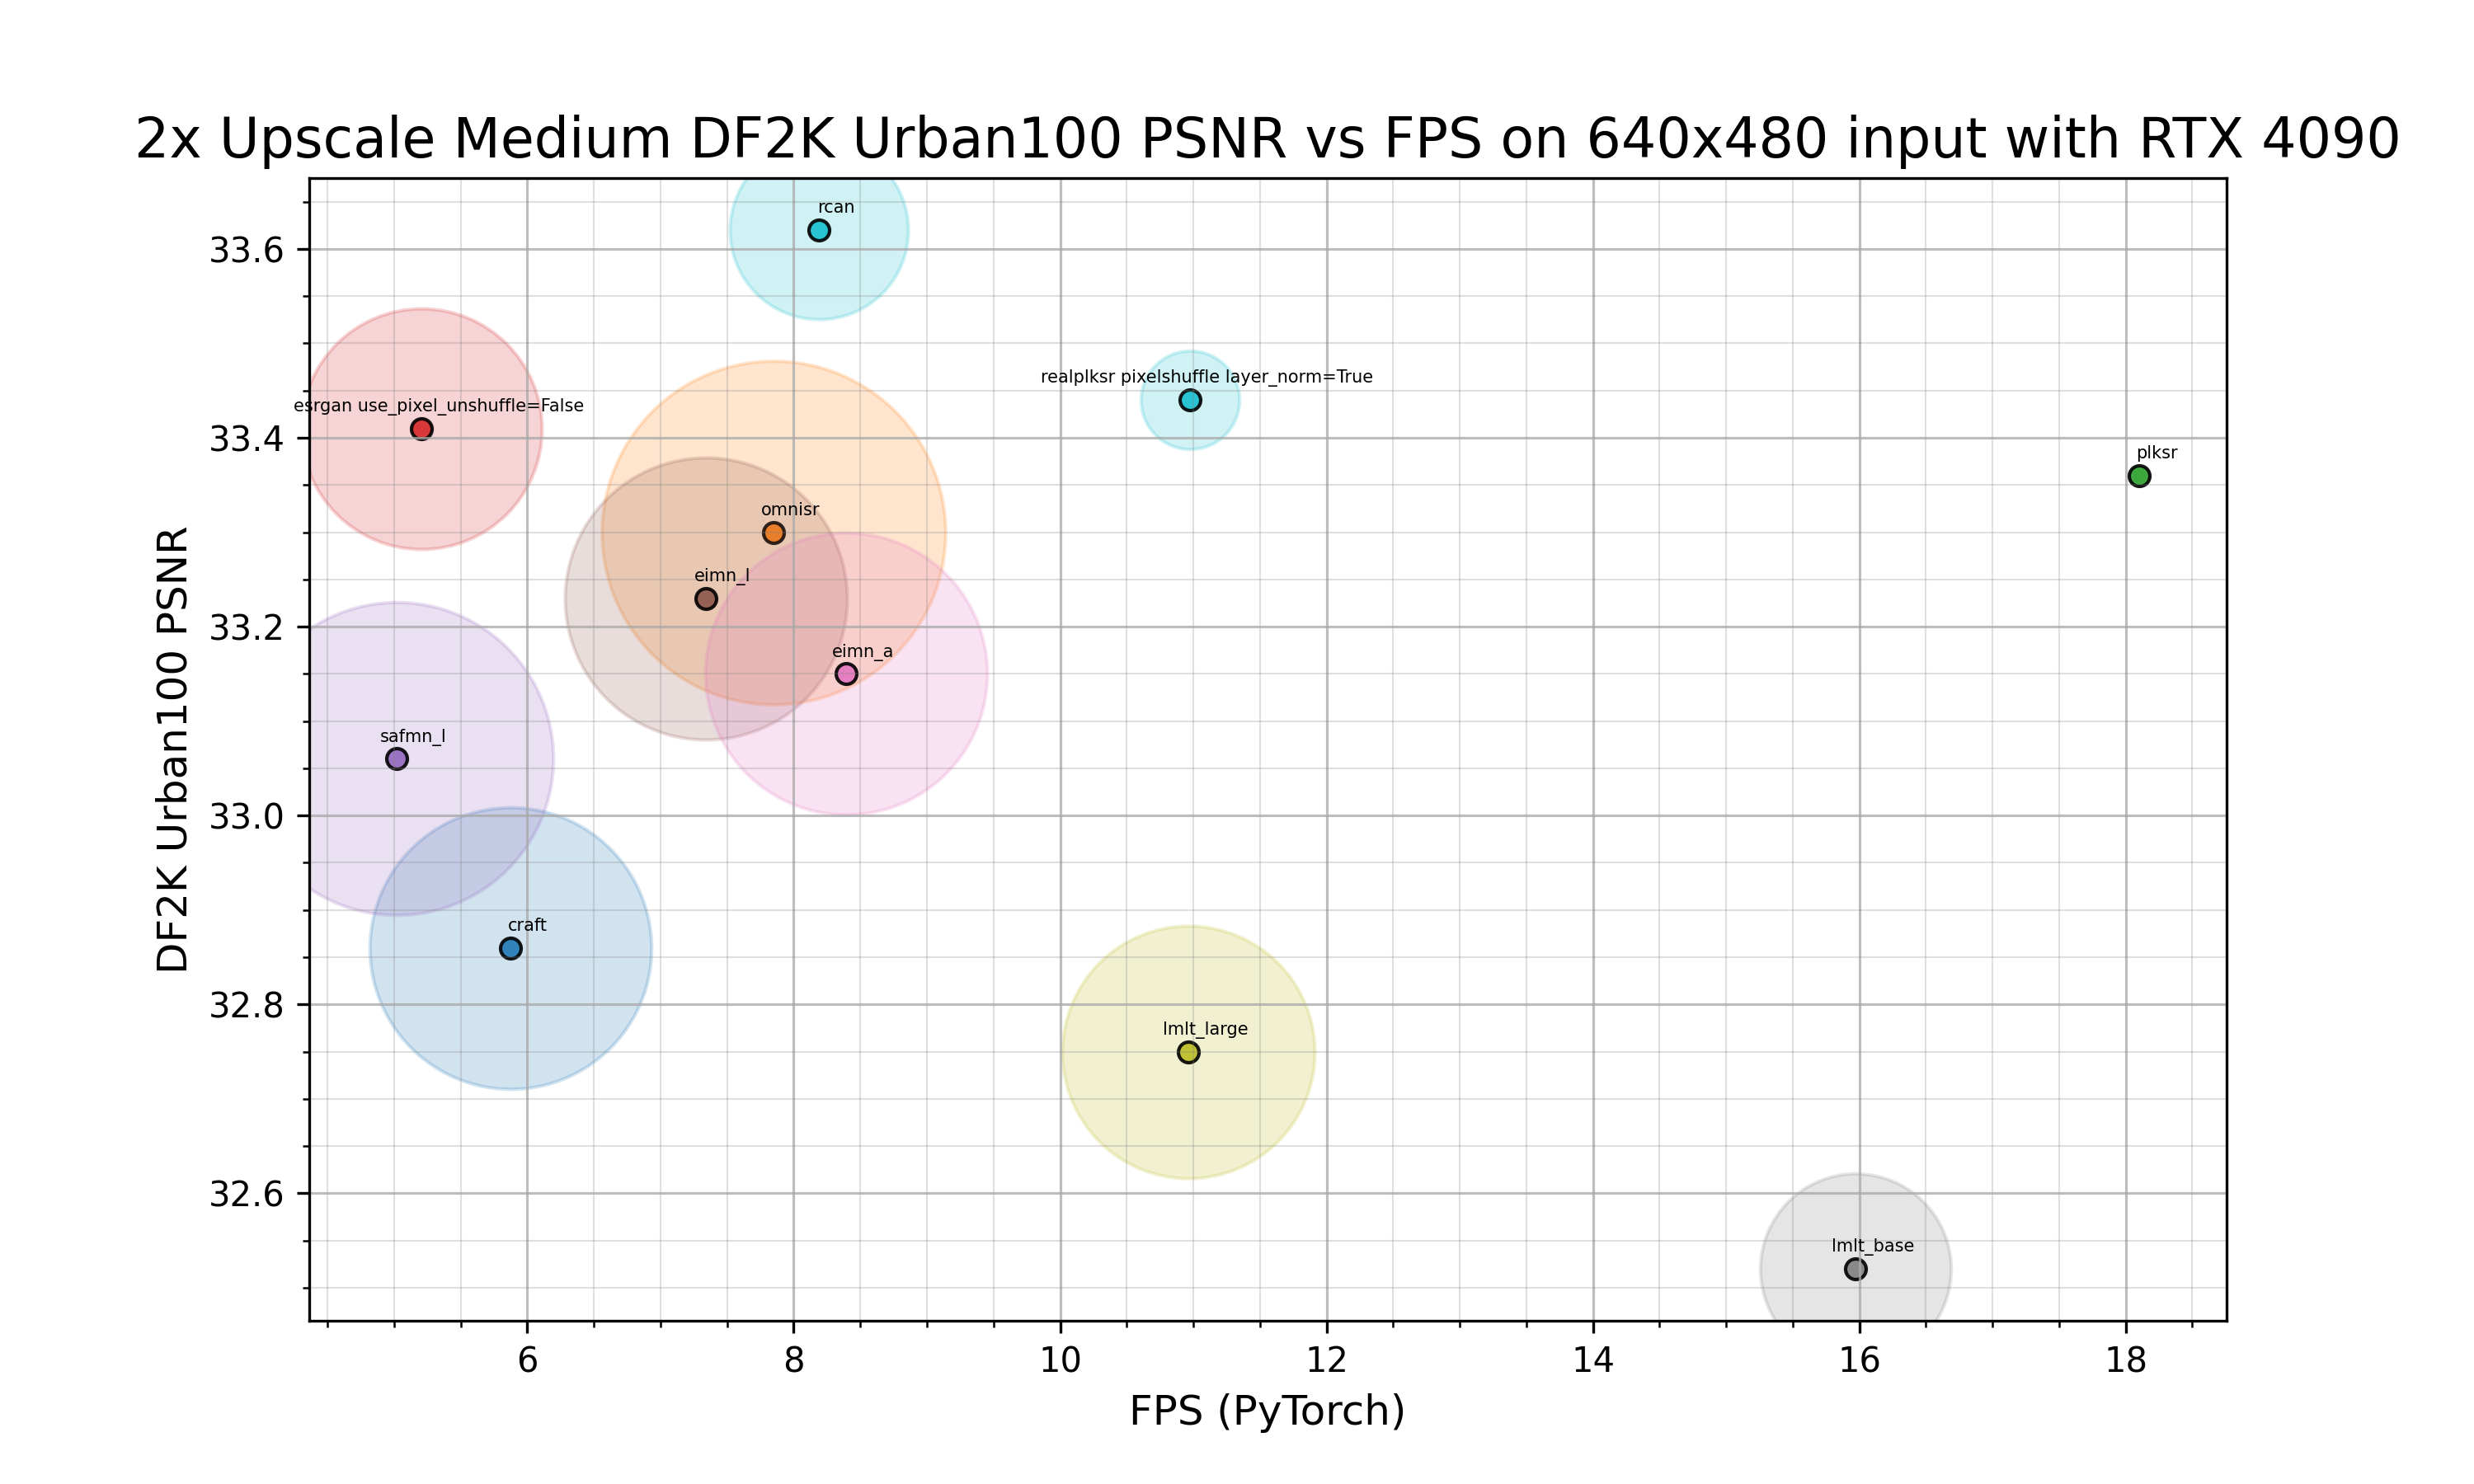
Architectures are separated into groups based on their PyTorch inference speed. The grouping is arbitrary and shouldn’t be considered as any official categorization. The groups are currently defined as follows:
Fast: On 4x model, inference speed of 640x480 input on RTX 4090 is more than 24 fps.
Medium: On 4x model, inference speed of 640x480 input on RTX 4090 is between 2 and 24 fps.
Slow: On 4x model, inference speed of 640x480 input on RTX 4090 is less than 2 fps.
Only architectures which have metrics with the training set DF2K and validation set Urban100 are shown.
VRAM is depicted by the size of the shaded circle behind each dot, larger means higher VRAM consumption.
4x
4x Slow Architectures
4x Medium Architectures
4x Fast Architectures

3x
3x Slow Architectures
3x Medium Architectures
3x Fast Architectures

2x
2x Slow Architectures
2x Medium Architectures
2x Fast Architectures
